suppressMessages(library(treeio))
suppressMessages(library(ggtree))
# library(ggimage)

nwk <- system.file("extdata", "sample.nwk", package = "treeio")
tree <- treeio::read.tree(nwk)
tree$node.label <- c("root", paste("node", 2:treeio::Nnode(tree)))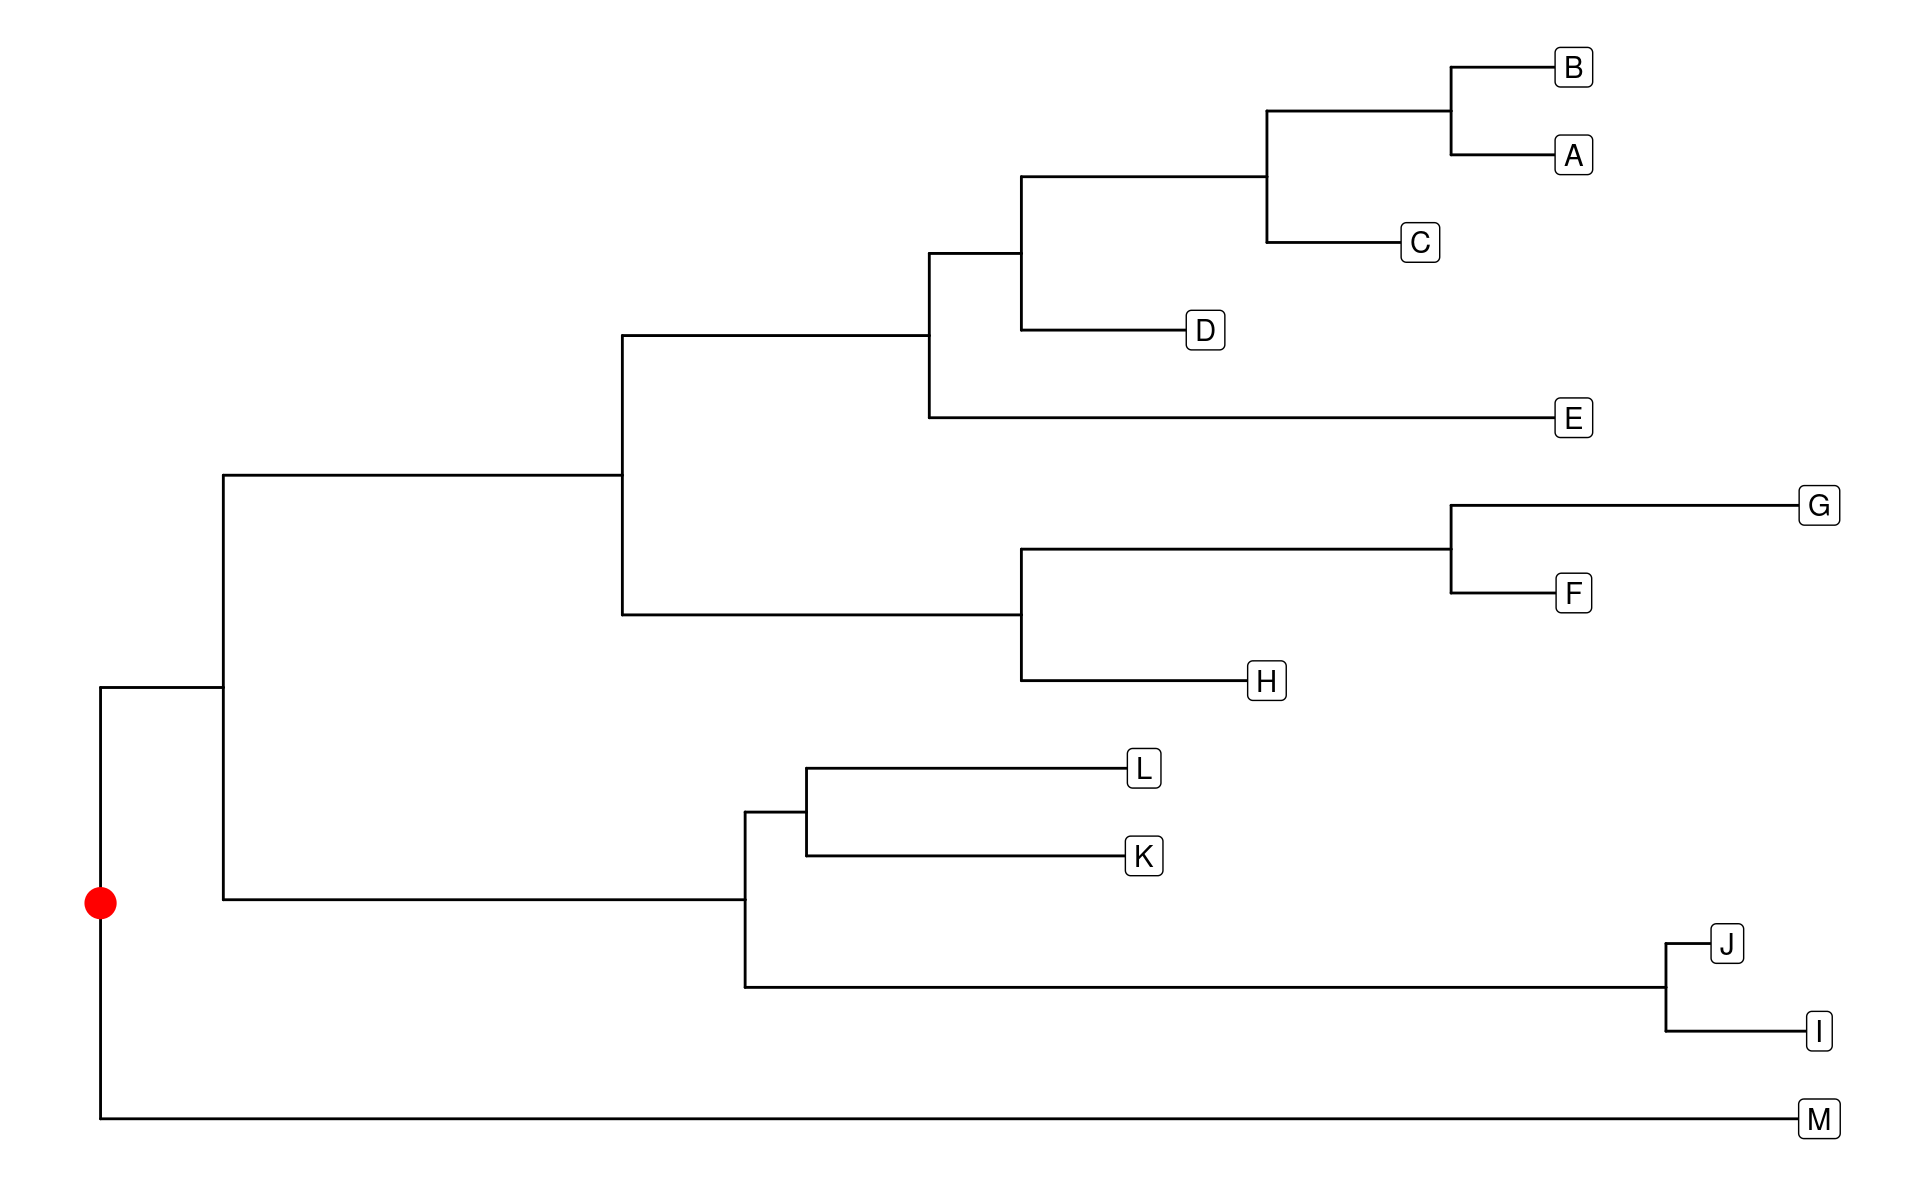
p <- ggtree(tree)ggtree–绘图1
ggtree
使用ggtree()函数等于使用ggplot(tree, aes(x, y)) + geom_tree() + theme_tree()。
对于ggtree及其相关包中的许多函数,我将它们按照“点-线-面-域”的形式进行了分类:
- 点:图中的单个元素,ggtree图中的“点”元素包括:
root,node,tip,branch。 - 线:不同“点”之间连接的线。
- 面:主要指由
node和tip组成的clade及树的整体布局layout。 - 域:可以理解为ggplot中的分面
facet,用来展示多个树,或与树相关的meta信息。
首先让我们加载一个树,并添加额外的相关信息,用于后续函数的使用说明。
点元素
点元素是ggtree树图中最重要的部分,因为每种点元素都有自己的坐标。使用fortify()函数提取绘图数据(见上一节),我们可以看到root就是x = 0的点,是一种特殊得node;isTip用来区分是否是tip;x,y构成了node与tip的坐标;branch与y构成了branch的坐标(此处坐标是branch的中心点);angle用来描述x极坐标化后的角度。
pd <- ggtree::fortify(tree)
pd
#> # A tbl_tree abstraction: 25 × 9
#> # which can be converted to treedata or phylo
#> # via as.treedata or as.phylo
#>   parent  node branch.length label isTip     x     y branch angle
#>    <int> <int>         <dbl> <chr> <lgl> <dbl> <dbl>  <dbl> <dbl>
#> 1     20     1             4 A     TRUE     48    12   46    332.
#> 2     20     2             4 B     TRUE     48    13   46    360
#> 3     19     3             5 C     TRUE     43    11   40.5  305.
#> 4     18     4             6 D     TRUE     36    10   33    277.
#> 5     17     5            21 E     TRUE     48     9   37.5  249.
#> 6     22     6             4 F     TRUE     48     7   46    194.
#> # ℹ 19 more rows

# root
dplyr::filter(pd, parent == node)
#> # A tibble: 1 × 9
#>   parent  node branch.length label isTip     x     y branch angle
#>    <int> <int>         <dbl> <chr> <lgl> <dbl> <dbl>  <dbl> <dbl>
#> 1     14    14             0 root  FALSE     0  3.46      0  95.8
让我们先简单地展示一下这些信息:
p +
  geom_nodelab(hjust = 0) +
  geom_text2(aes(subset = branch != 0, x = branch), label = "branch") +
  geom_tiplab()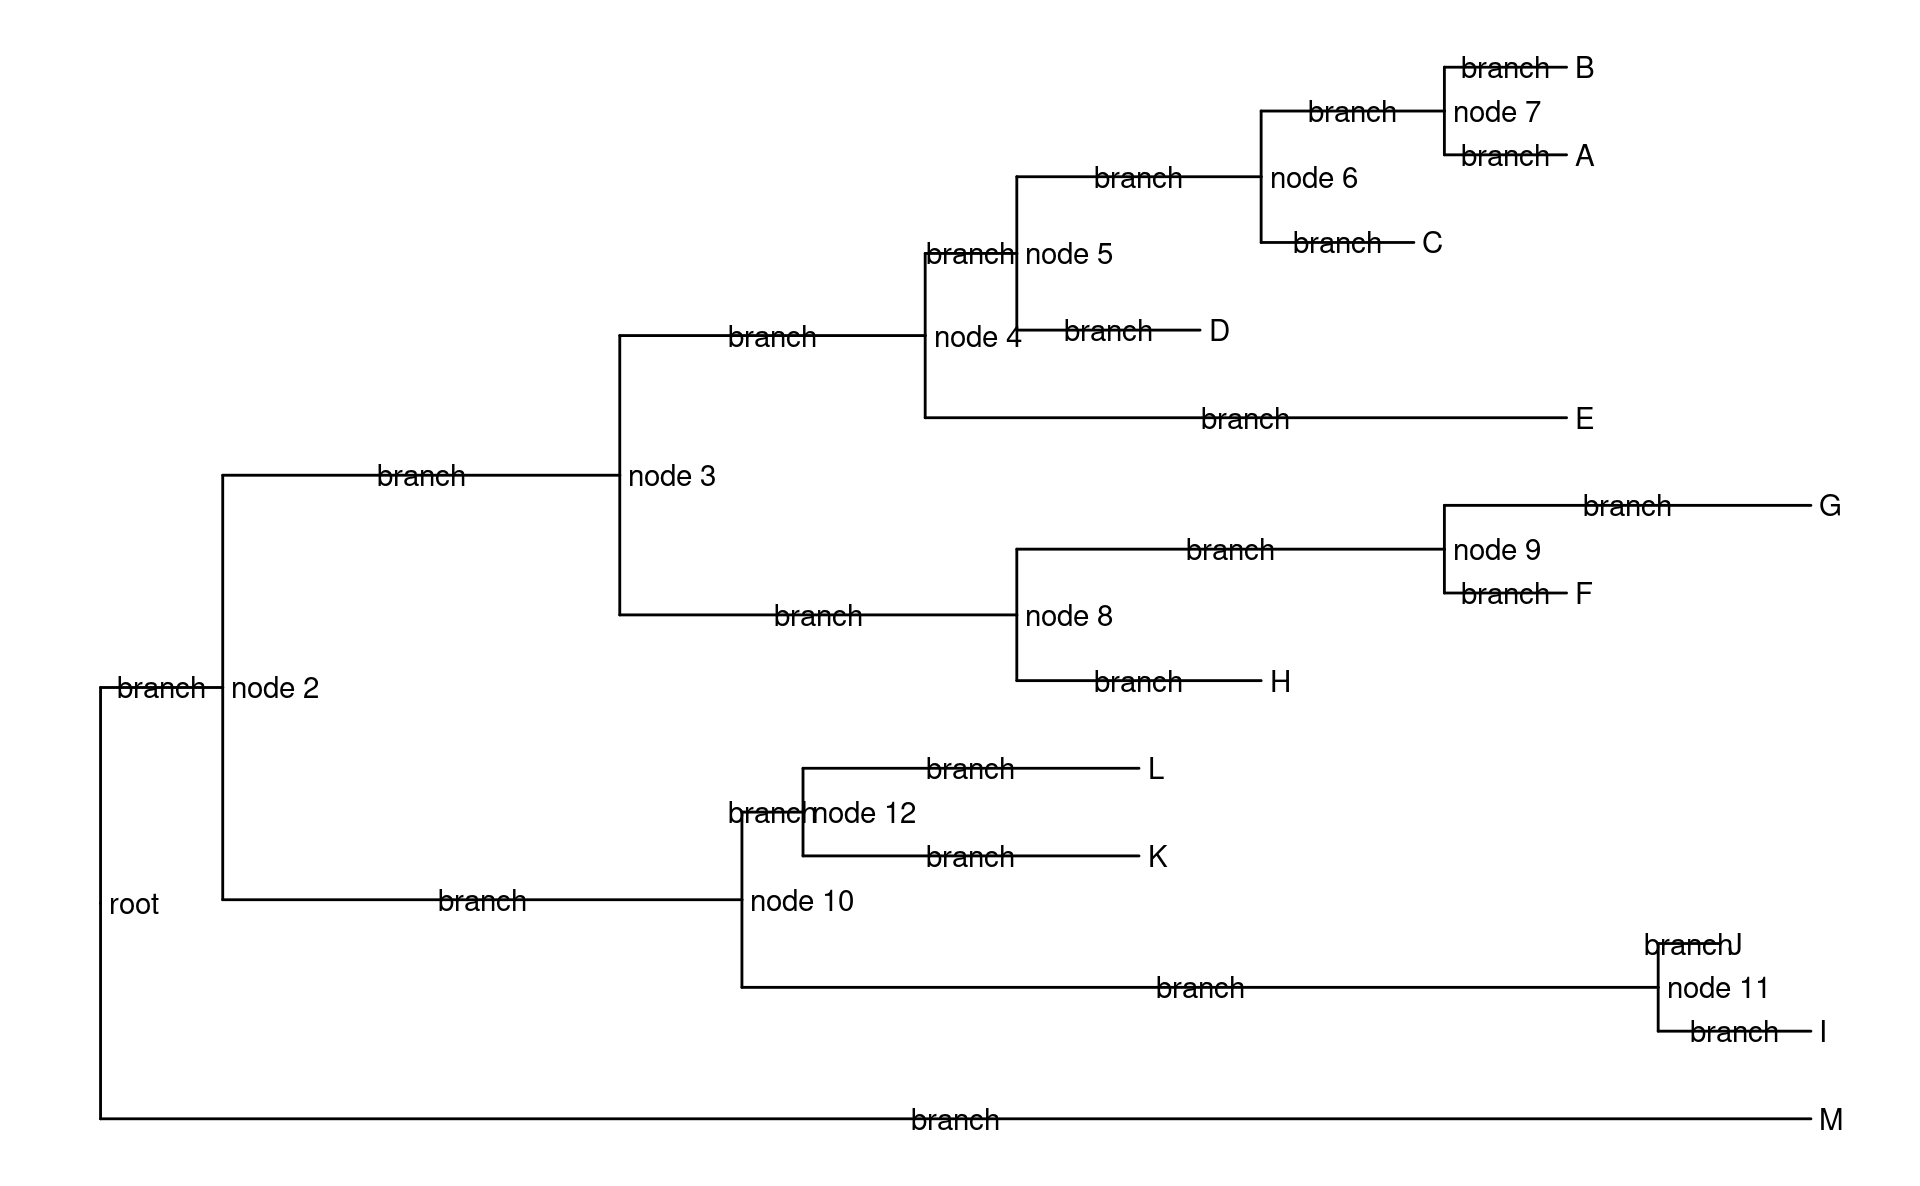
root相关的函数
-
geom_rootpoint():与geom_point()类似,但是单独调整root的美学映射。 -
geom_rootedge():调整root相关branch的长度,上面的结果也显示,默认长度为0。
p +
  geom_rootpoint(shape = 21, size = 5, color = "red", fill = "blue") +
  geom_rootedge(rootedge = 2)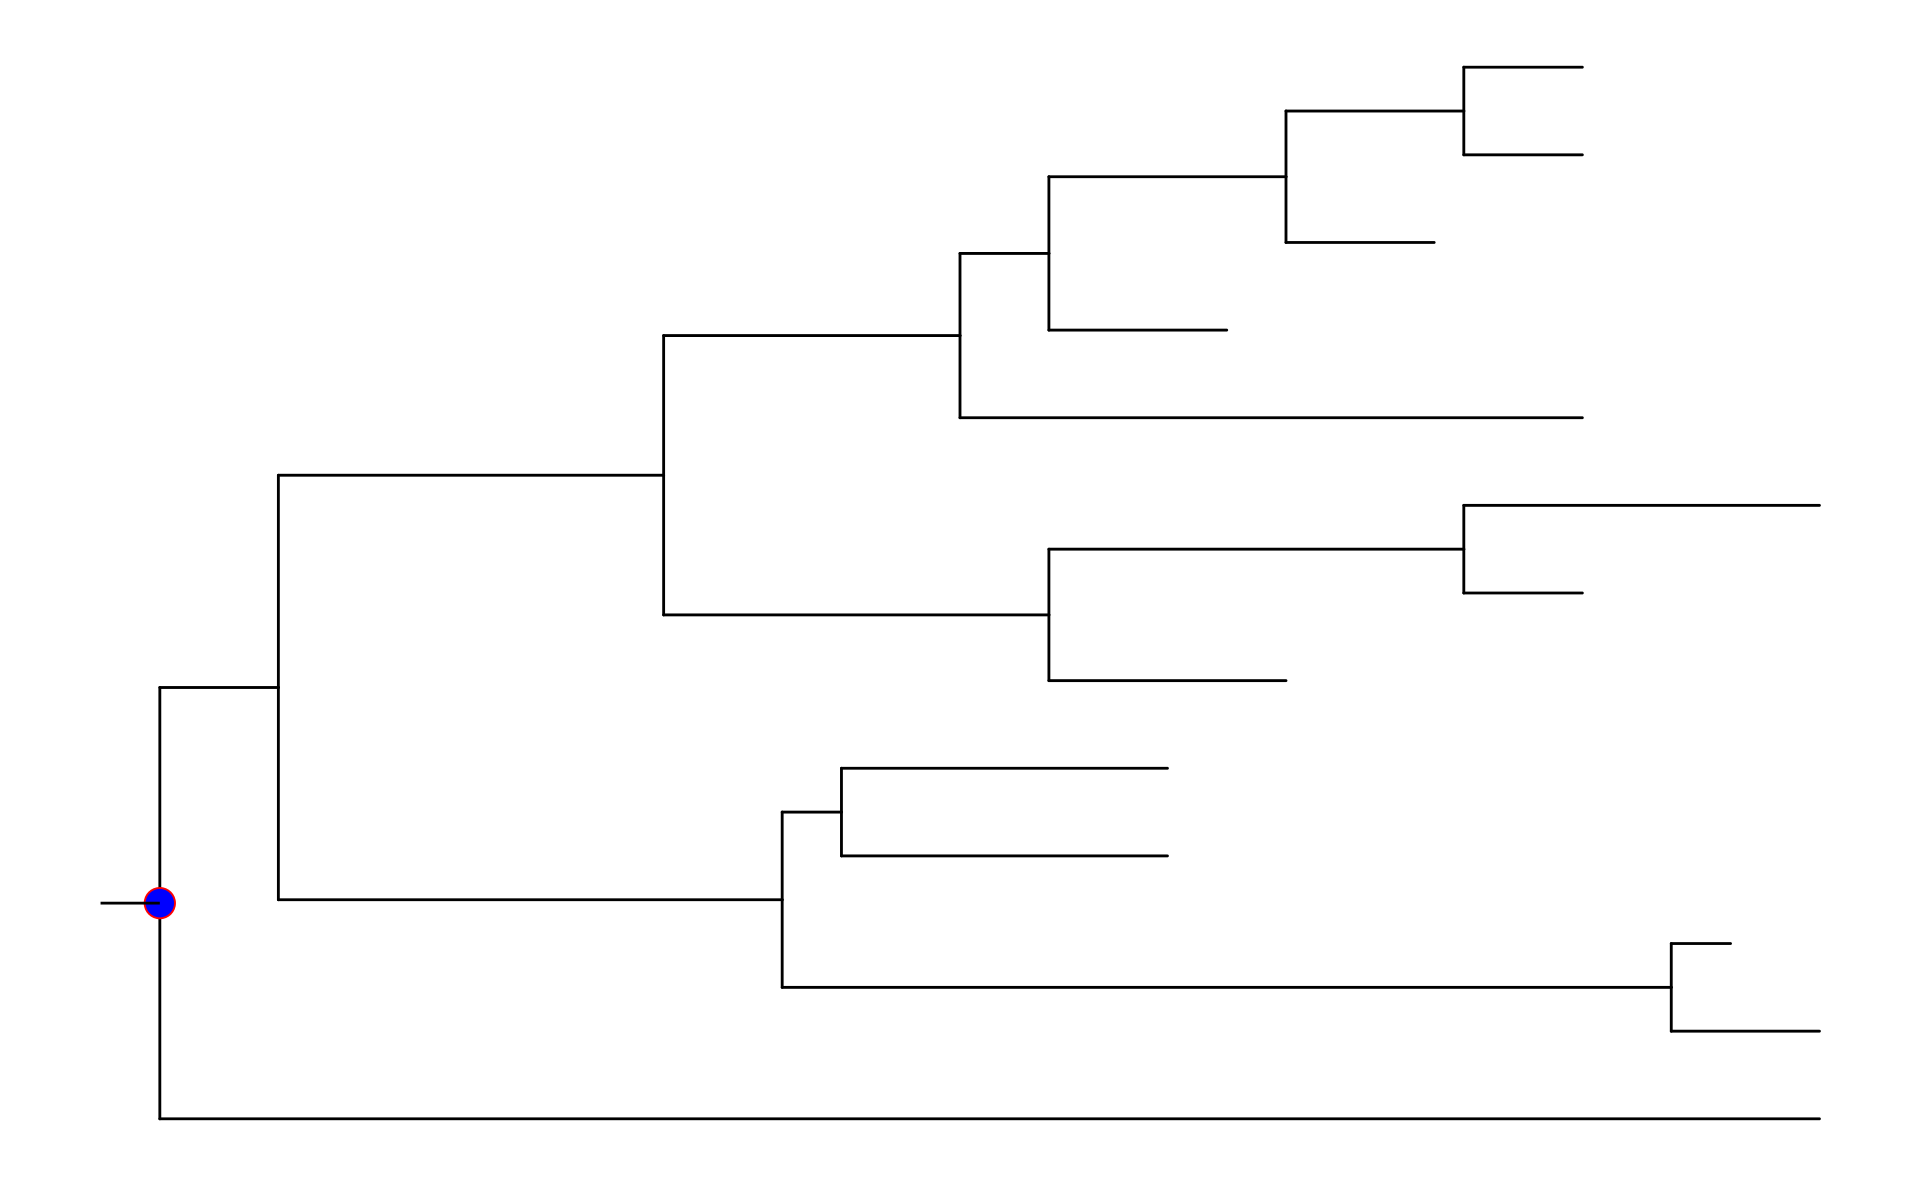
node相关的函数
node可以有具体的含义,例如共同祖先,也可以没有。相关的函数有:
-
geom_nodepoint():与geom_point()类似,调整node美学映射。 -
geom_nodelab():绘制node的标签。
p +
  geom_nodepoint(shape = 21, size = 5, color = "red", fill = "blue") +
  geom_nodelab(hjust = 0)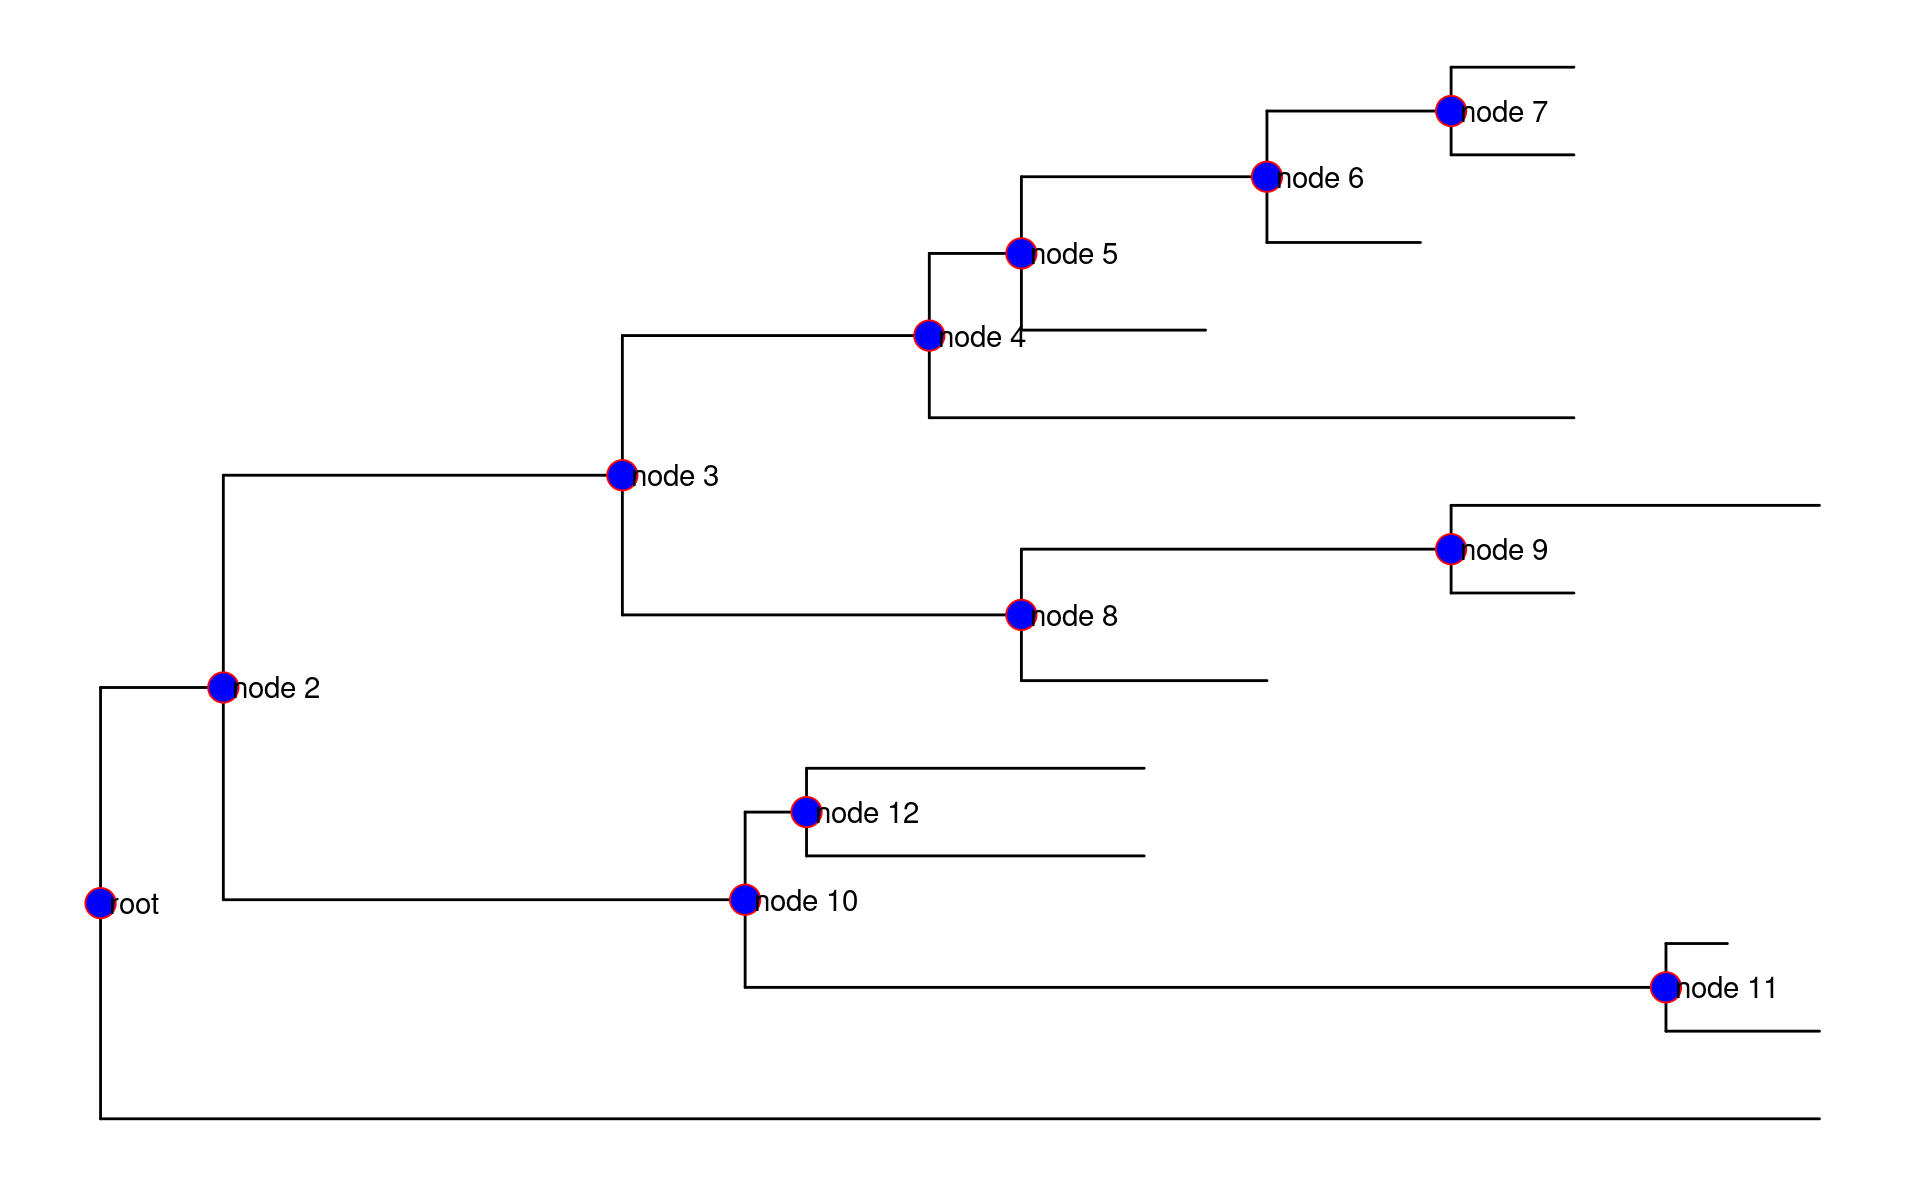
从图中也可以看到,root属于node,相关美学映射及label被调整。可以使用subset映射来剔除对root的调整:
p +
  geom_nodepoint(aes(subset = node != parent), shape = 21, size = 5, color = "red", fill = "blue") +
  geom_nodelab(aes(subset = node != parent), hjust = 0)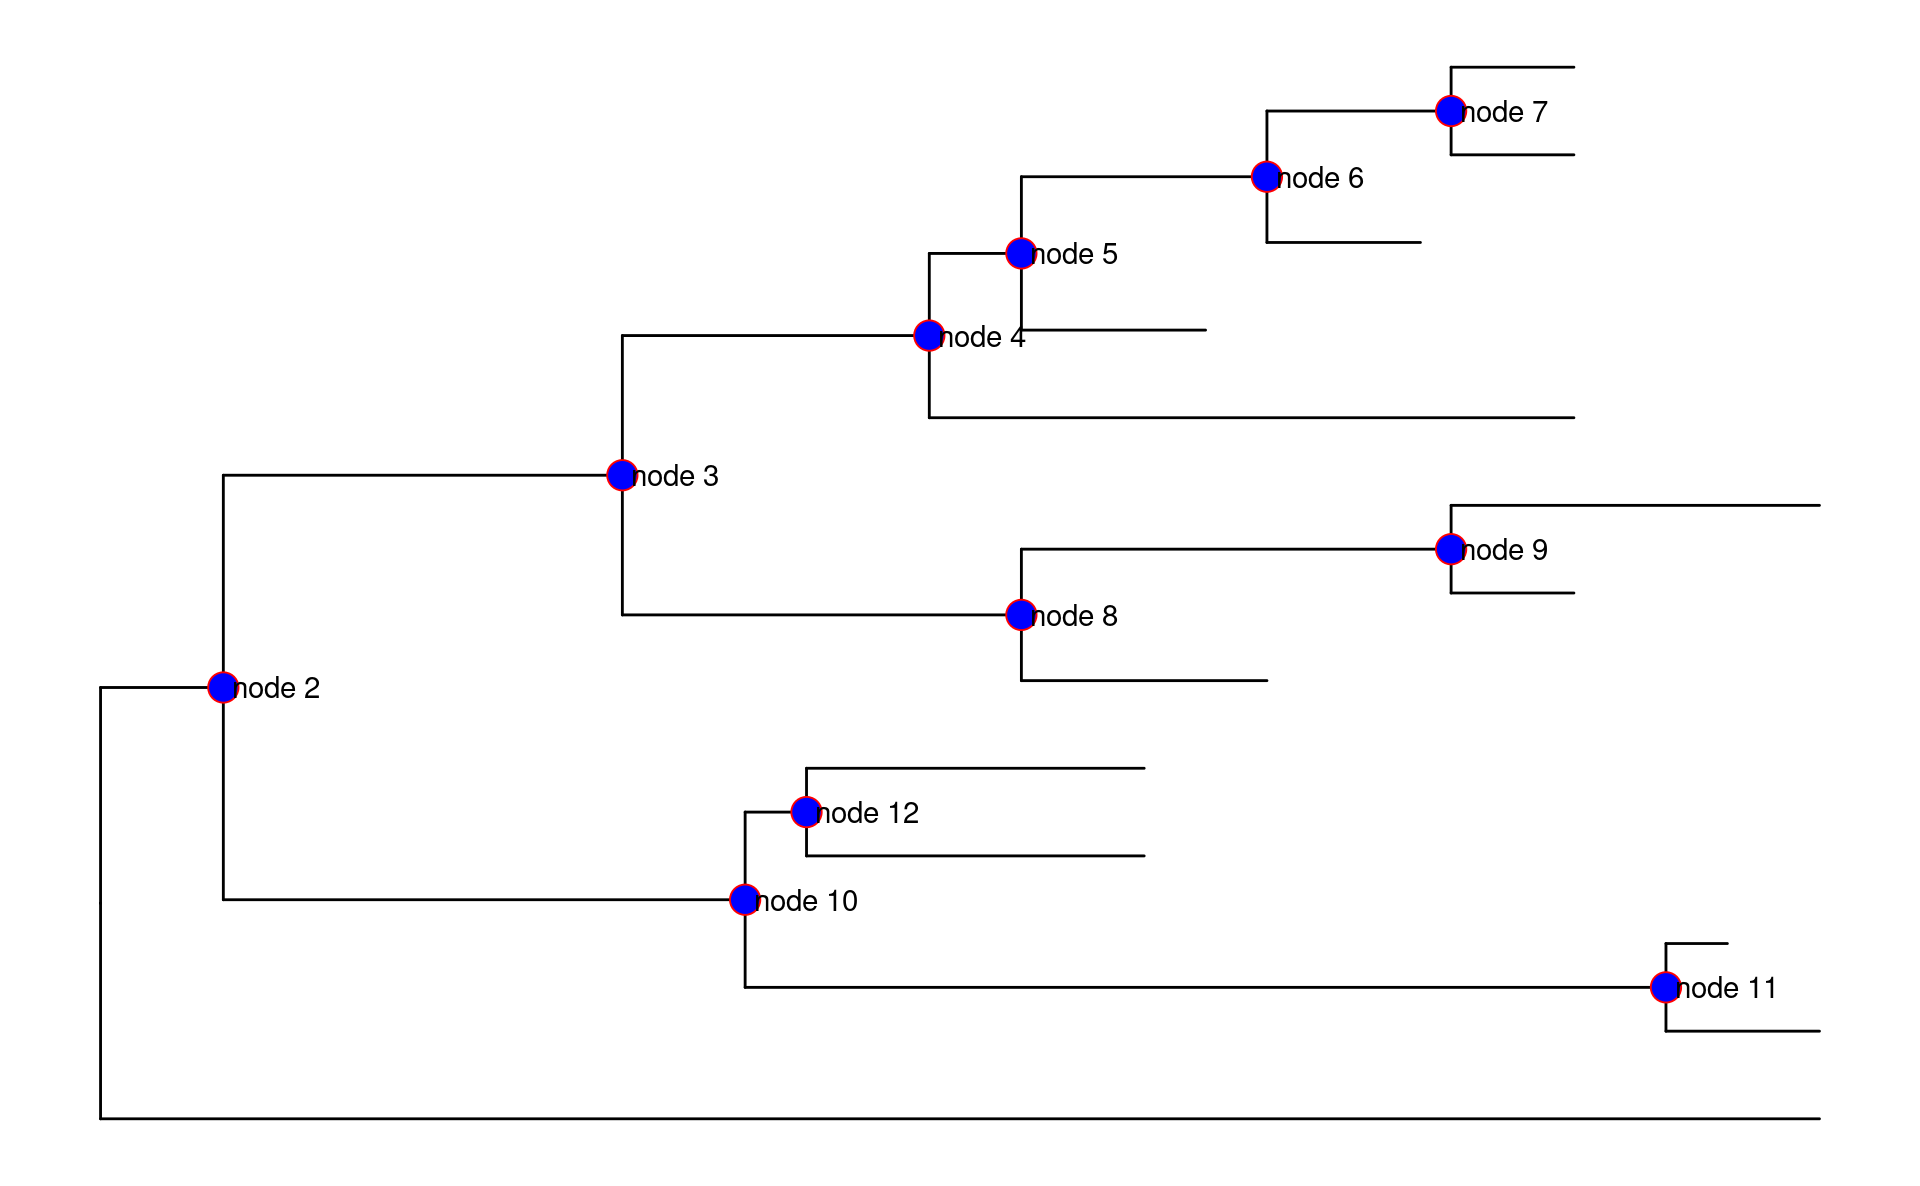
tip相关的函数
tip也称为taxa,是树末端的点。与之相关的函数有:
-
geom_tippoint():与geom_point()类似,调整tip美学映射。 -
geom_tiplab():绘制tip的标签。
p +
  geom_tippoint(shape = 21, size = 5, color = "red", fill = "blue") +
  geom_tiplab()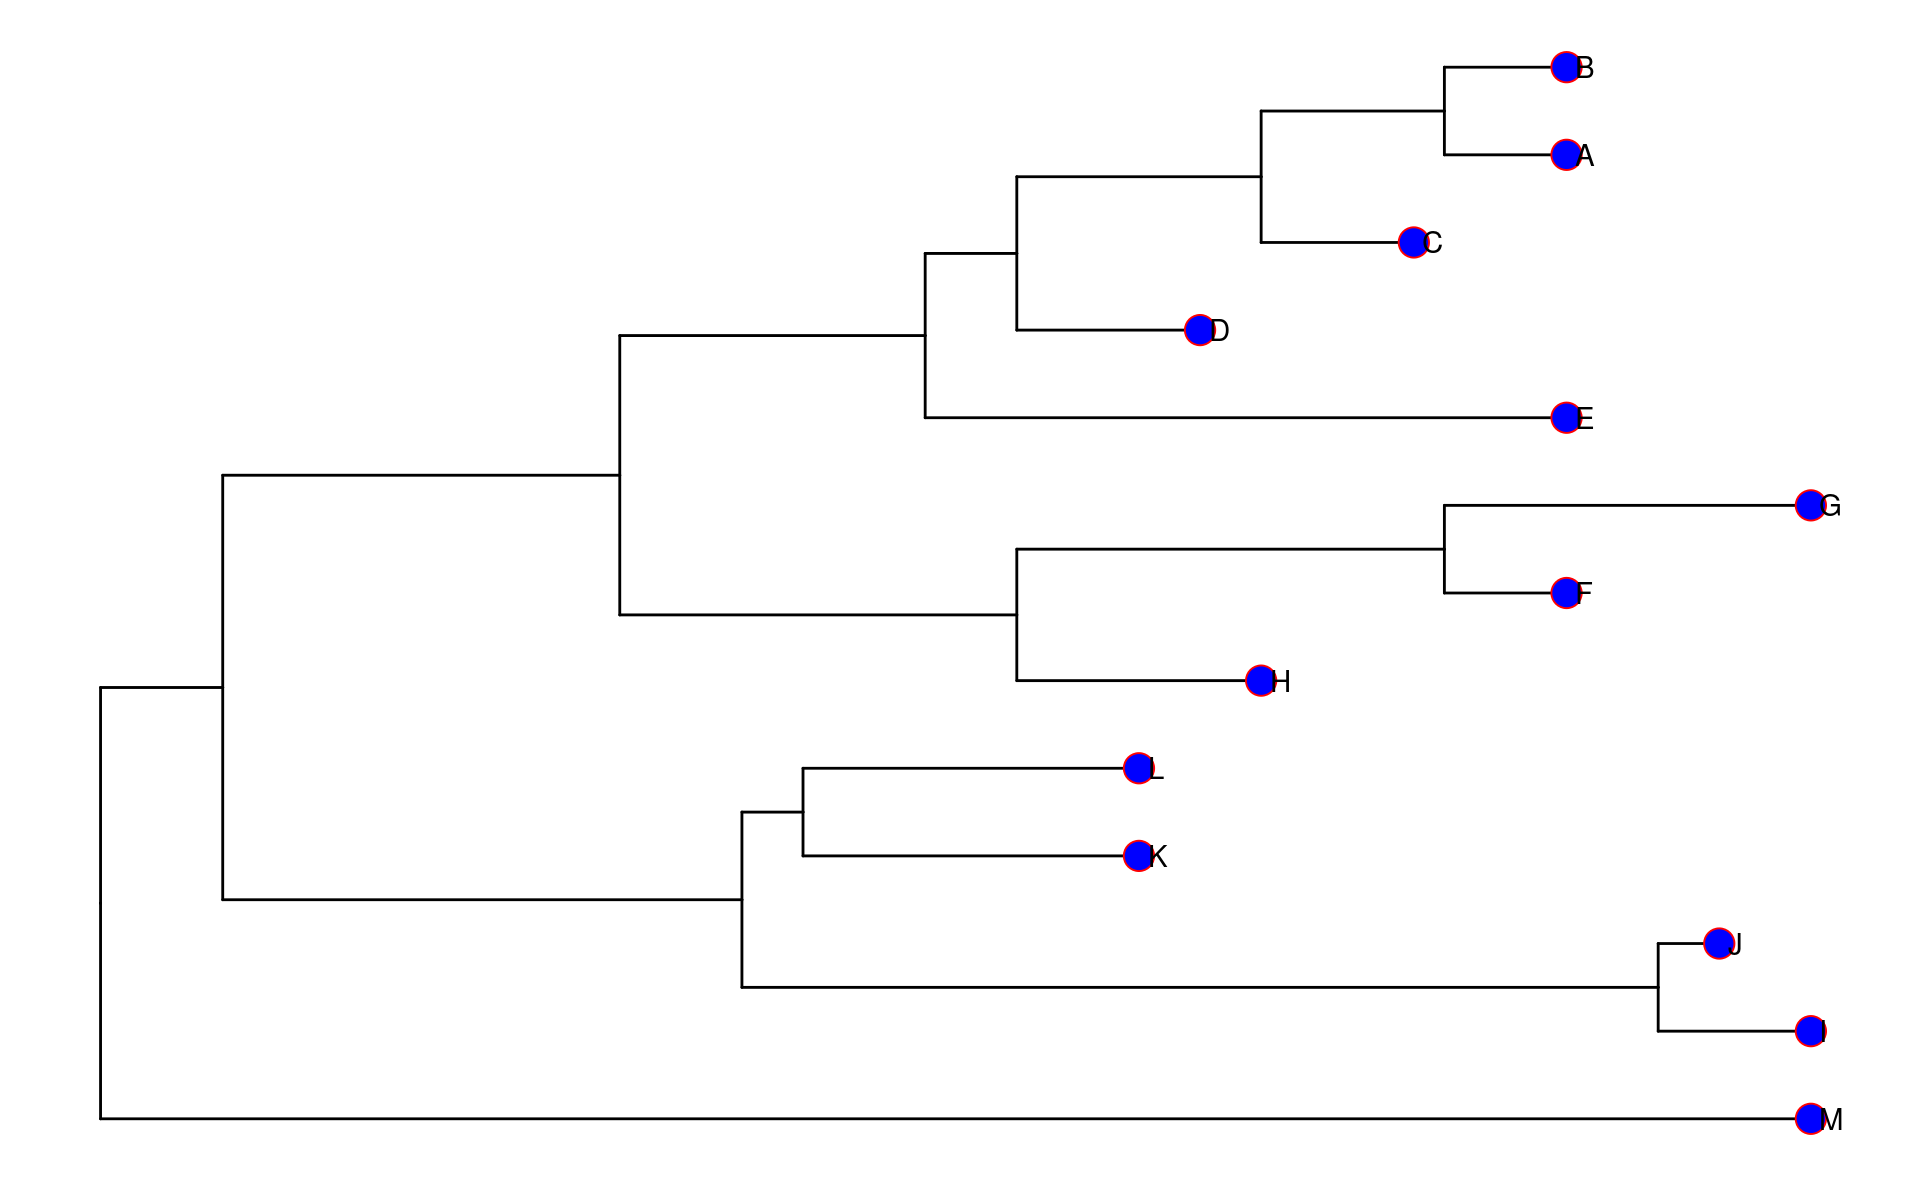
geom_tiplab()除label映射外,还有image映射,可以用来添加额外的图片或“phhylopic”。
annimals <- c("Homo sapiens", "Pan troglodytes", "Gorilla gorilla", "Pongo abelii", "Hylobates lar", "Macaca mulatta", "Papio anubis", "Lemur catta", "Mus musculus", "Rattus norvegicus", "Canis lupus", "Felis catus", "Gallus gallus")

d <- ggimage::phylopic_uid(annimals)
d$name <- tree$tip.label

ggtree(tree) %<+% d +
  geom_tiplab(aes(image = uid), color = "grey", geom = "phylopic", offset = 2.5) +
  hexpand(0.1)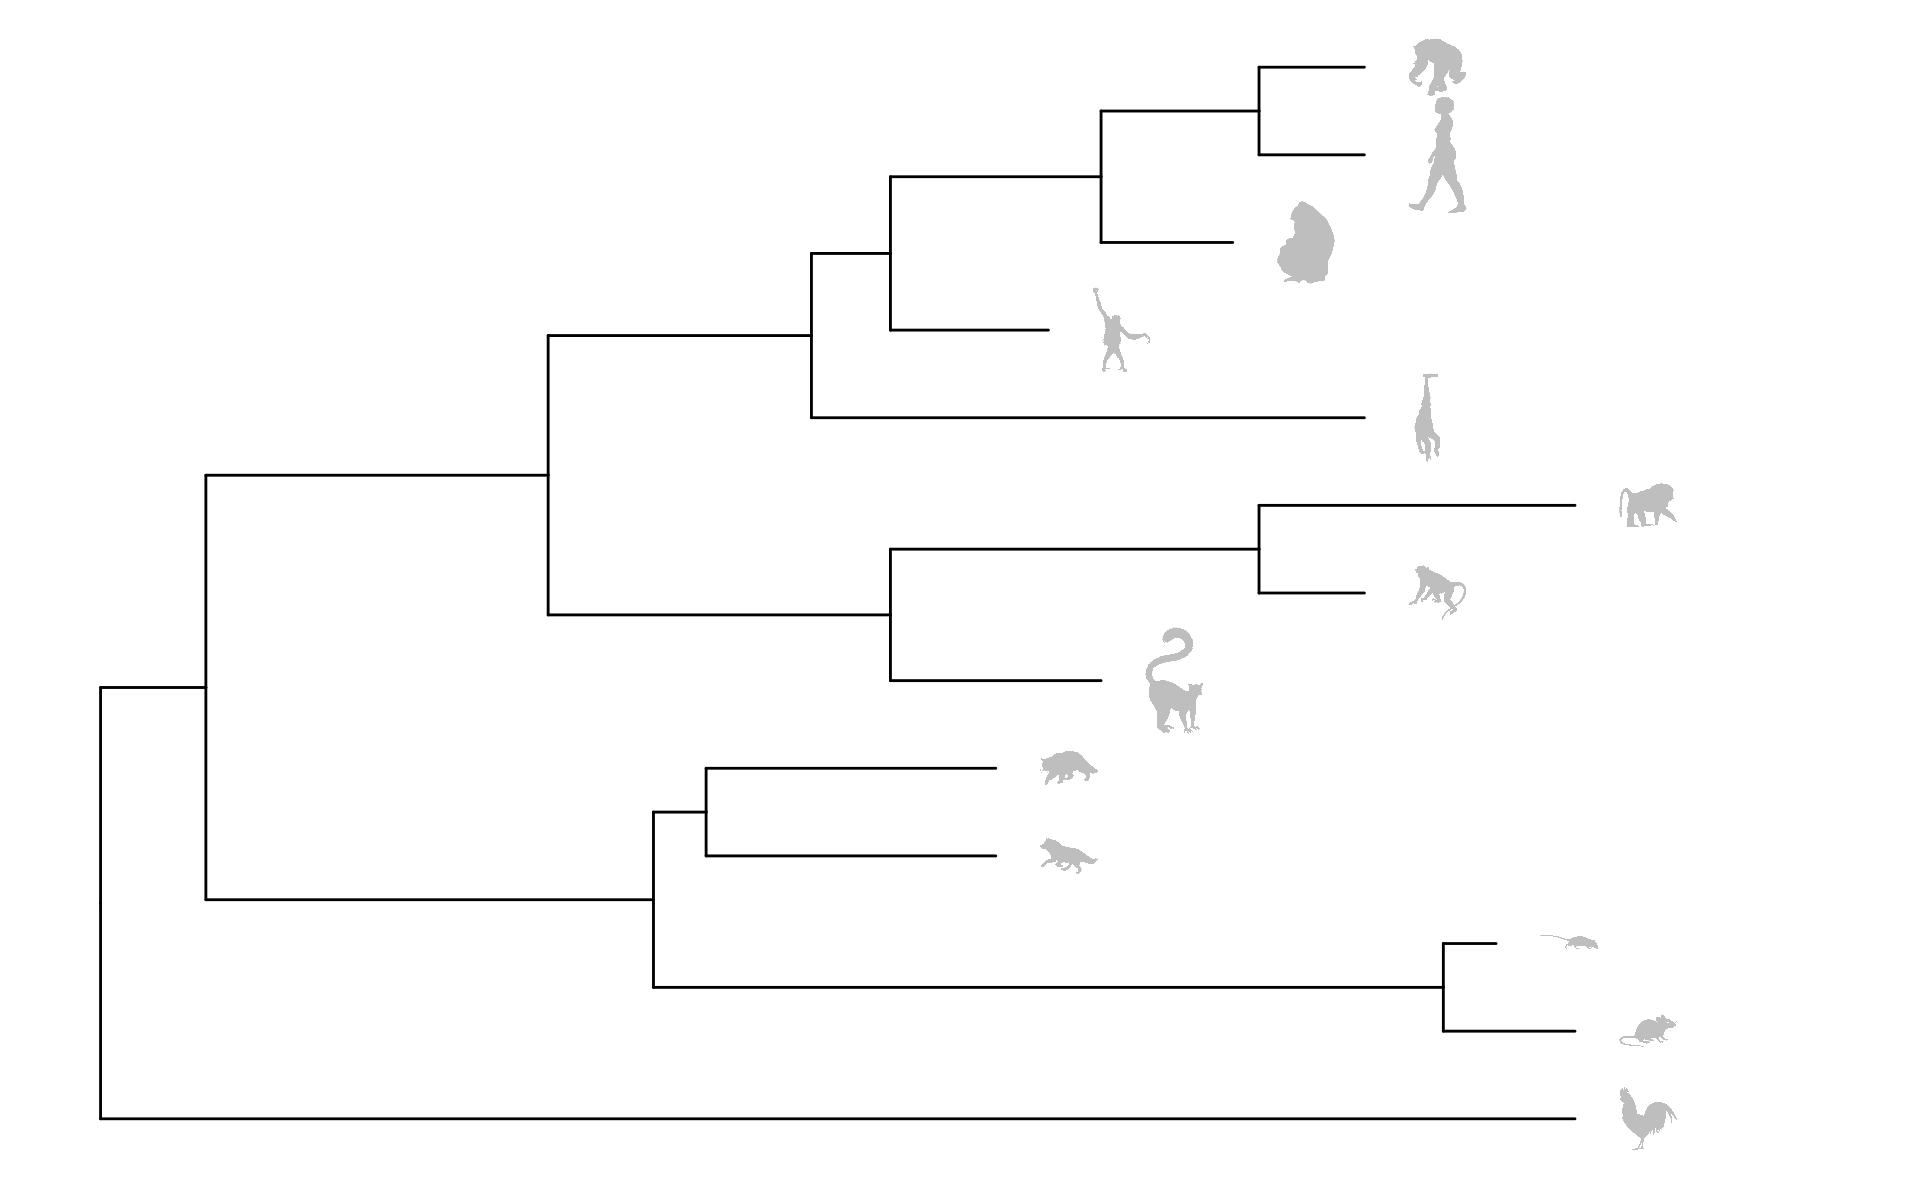
geom_tiplab()也支持解析emoji字符,详见ggtree-chaper8。
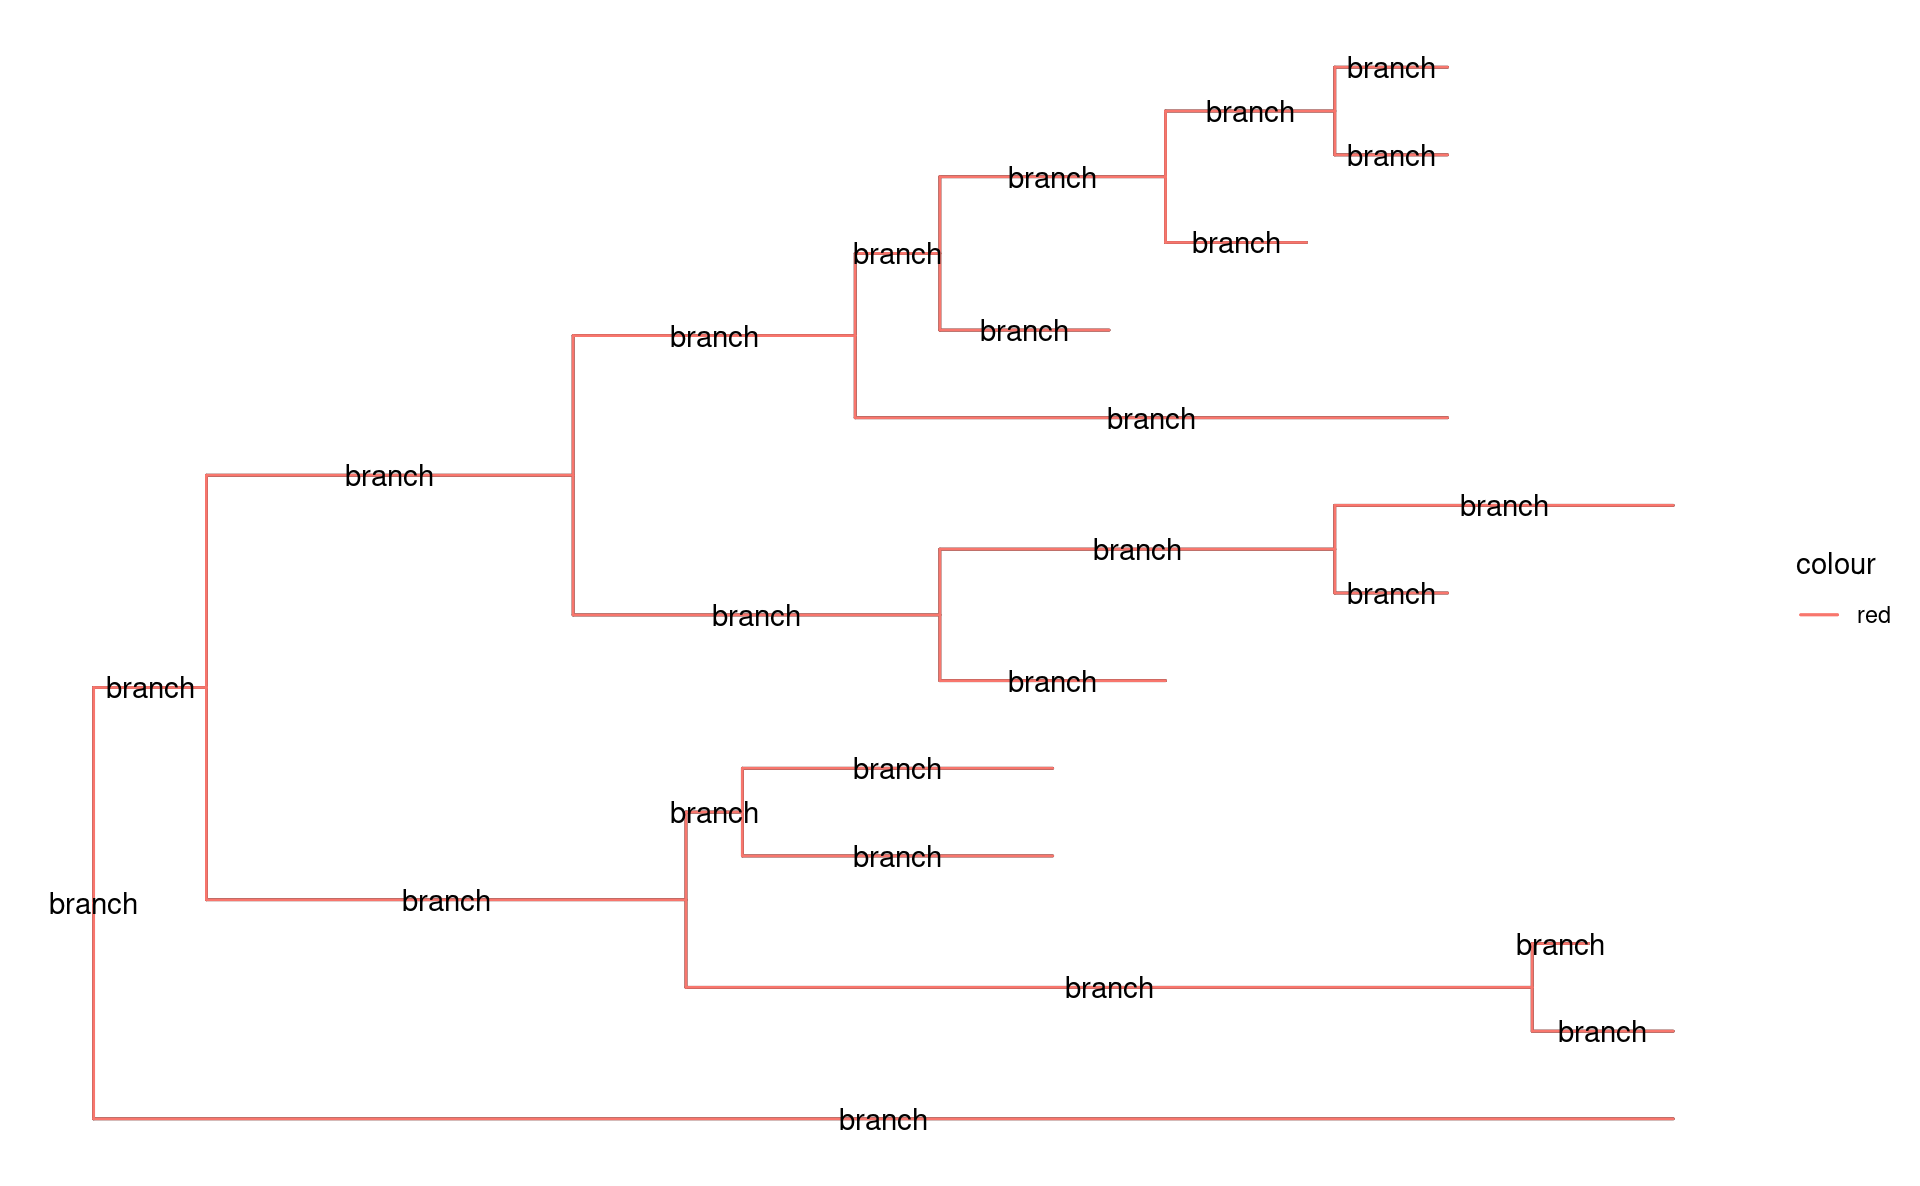
branch相关的函数
branch没有对应的函数,它作为树的主体,其映射由ggtree()或geom_tree()直接进行调整,标签可以由geom_text()或geom_label()进行设置:
其他相关函数
除上述函数外,ggtree提供了一些其他用来处理“点”元素的函数,它们大多具有普适性,大致可以分为两类:
ggtree特有
geom_range()
如果某个“点”元素具有某个范围信息,那么就可以使用geom_range()进行绘制,例如我们为tree添加枝长的范围,并使用scale_x_range()为其添加x轴(但轴的意义不大,具体可见ggtree-5.3):
rangeInfo <- tibble(
  label = c("node 2", "A"),
  year = list(c(3, 7), c(1, 2))
)

tree2 <- full_join(tree, rangeInfo, by = "label")

ggtree(tree2) +
  geom_tiplab() +
  geom_nodelab() +
  geom_range("year", color = "red", alpha = .6, size = 2) +
  scale_x_range() +
  theme_tree2()
#> Warning: Using `size` aesthetic for lines was deprecated in ggplot2 3.4.0.
#> ℹ Please use `linewidth` instead.
#> ℹ The deprecated feature was likely used in the ggtree package.
#>   Please report the issue at <https://github.com/YuLab-SMU/ggtree/issues>.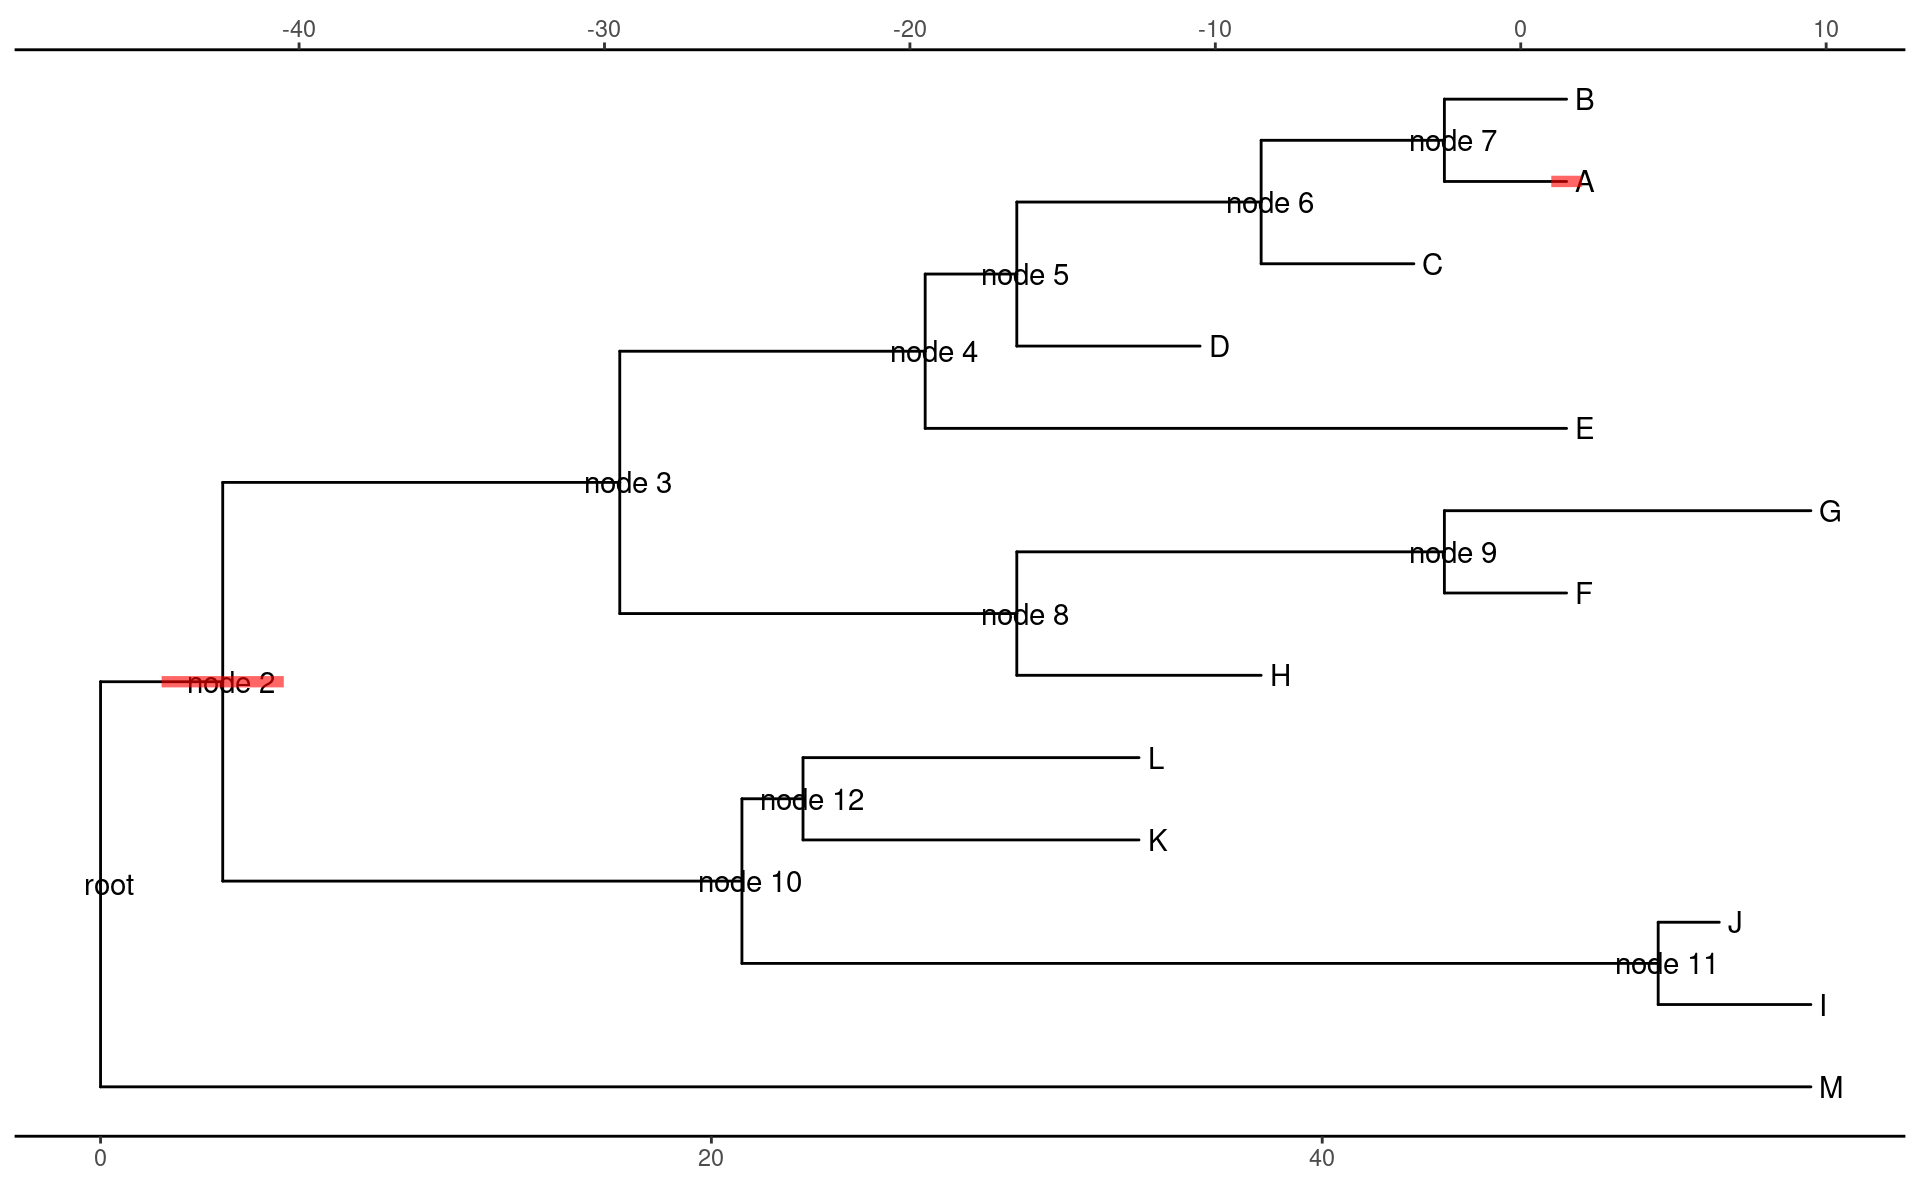
geom_inset()
geom_inset()接受一个ggplot对象list,且list的name是node(tip)的编号(即pd中的node列)。它会将这些对象绘制到node(tip)上或node(tip)对应的branch上。
ggtree提供了nodepie()与nodebar()两个函数,分别绘制饼图和条形图,你可以创建任何ggplot对象,或者使用ggplotify包来将某个对象转换为ggplot对象。
df2 <- as.data.frame(abs(matrix(rnorm(39), ncol = 3)))
df2$node <- 1:13
bars <- nodebar(df2, cols = 1:3)
bars <- lapply(bars, function(g) g + scale_fill_discrete())
#> Error in `scale_fill_discrete()`:
#> ! could not find function "scale_fill_discrete"

p + geom_inset(bars, width = .08, height = .05, x = "node")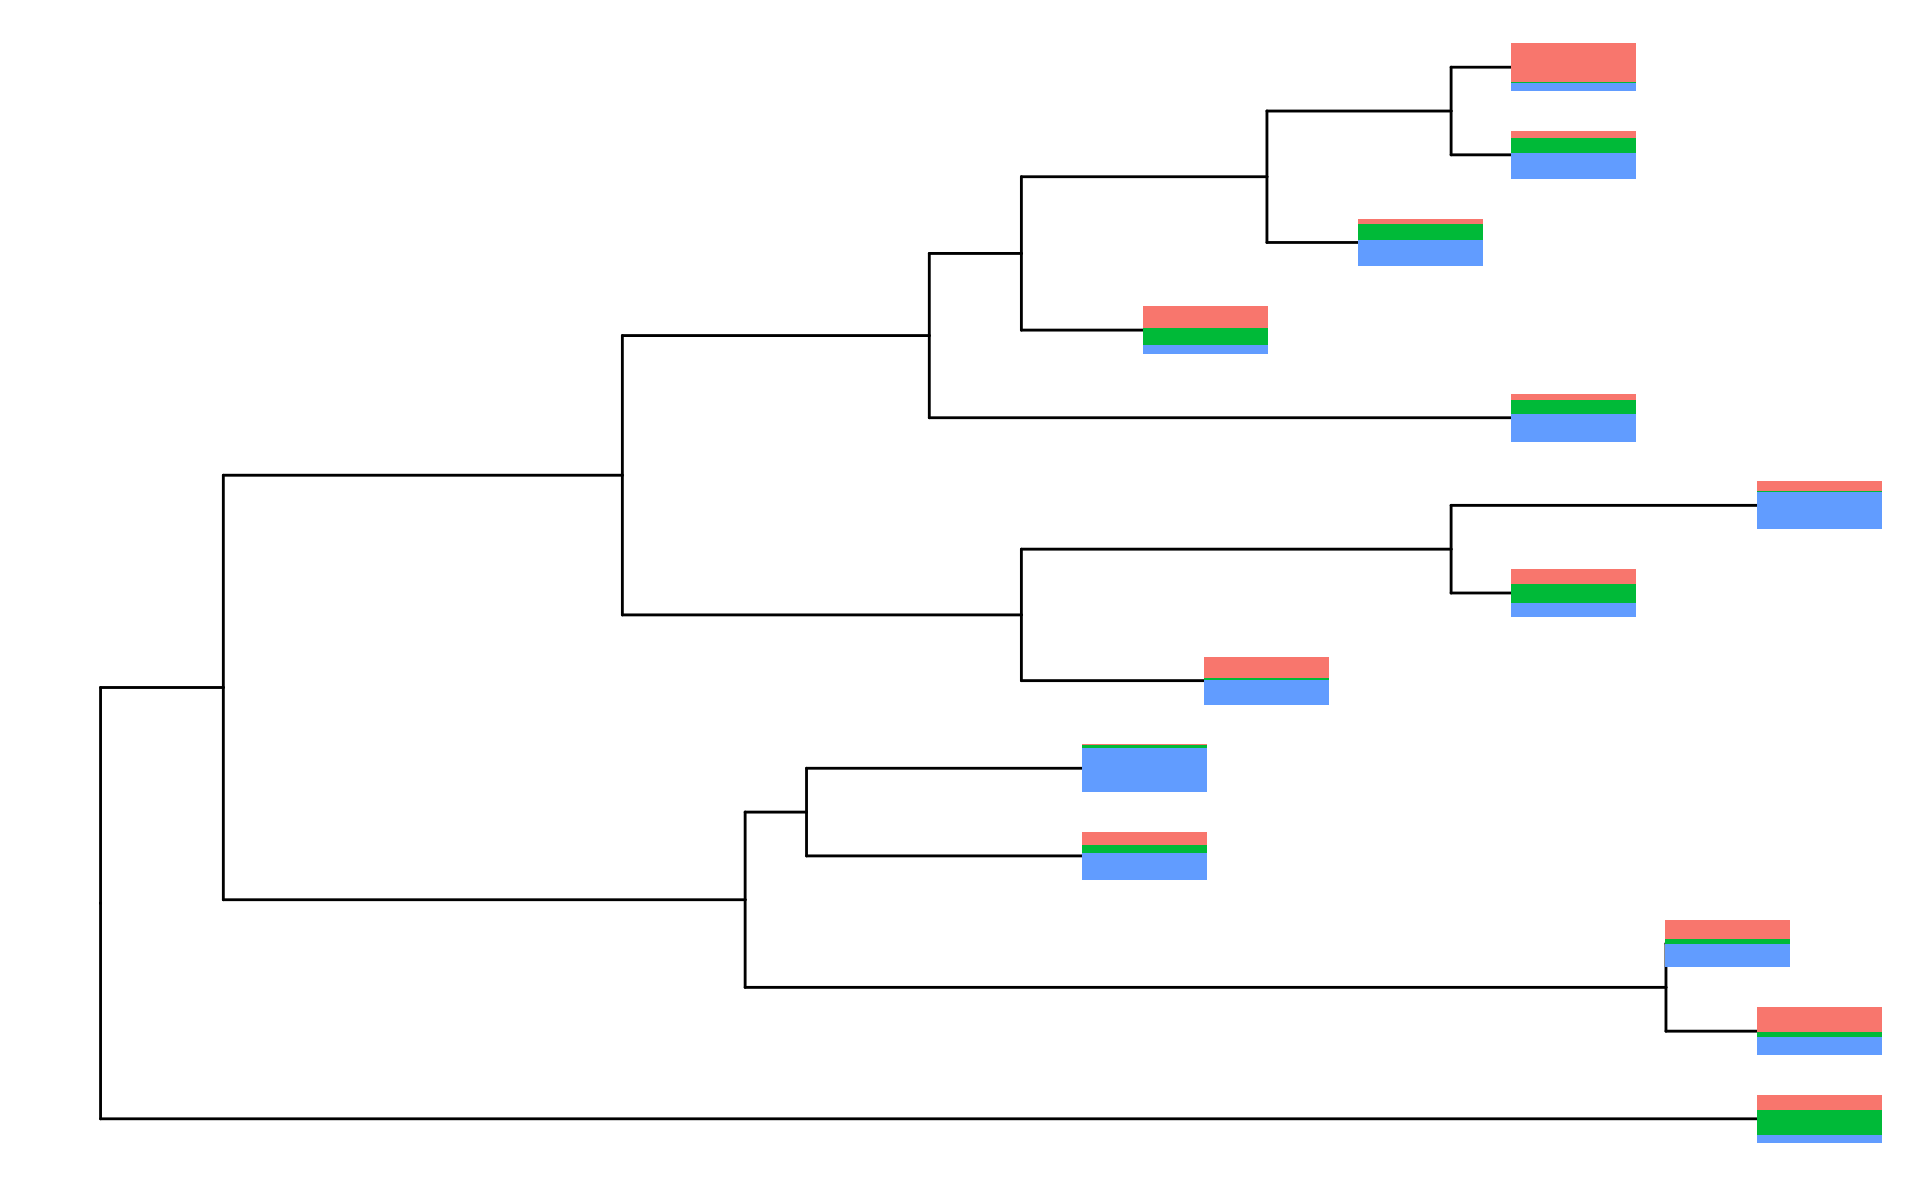
Warning
在实际运行中,nodepie()会报错,暂时不清楚原因
ggplot升级版
具有subset映射,可以直接根据subset映射`对绘图数据进行过滤,然后进行绘制:
p +
  geom_label2(aes(subset = isTip, label = label)) +
  geom_point2(aes(subset = !isTip), color = "red", size = 5)
#> Warning in geom_label2(aes(subset = isTip, label = label)): Ignoring unknown
#> parameters: `label.size`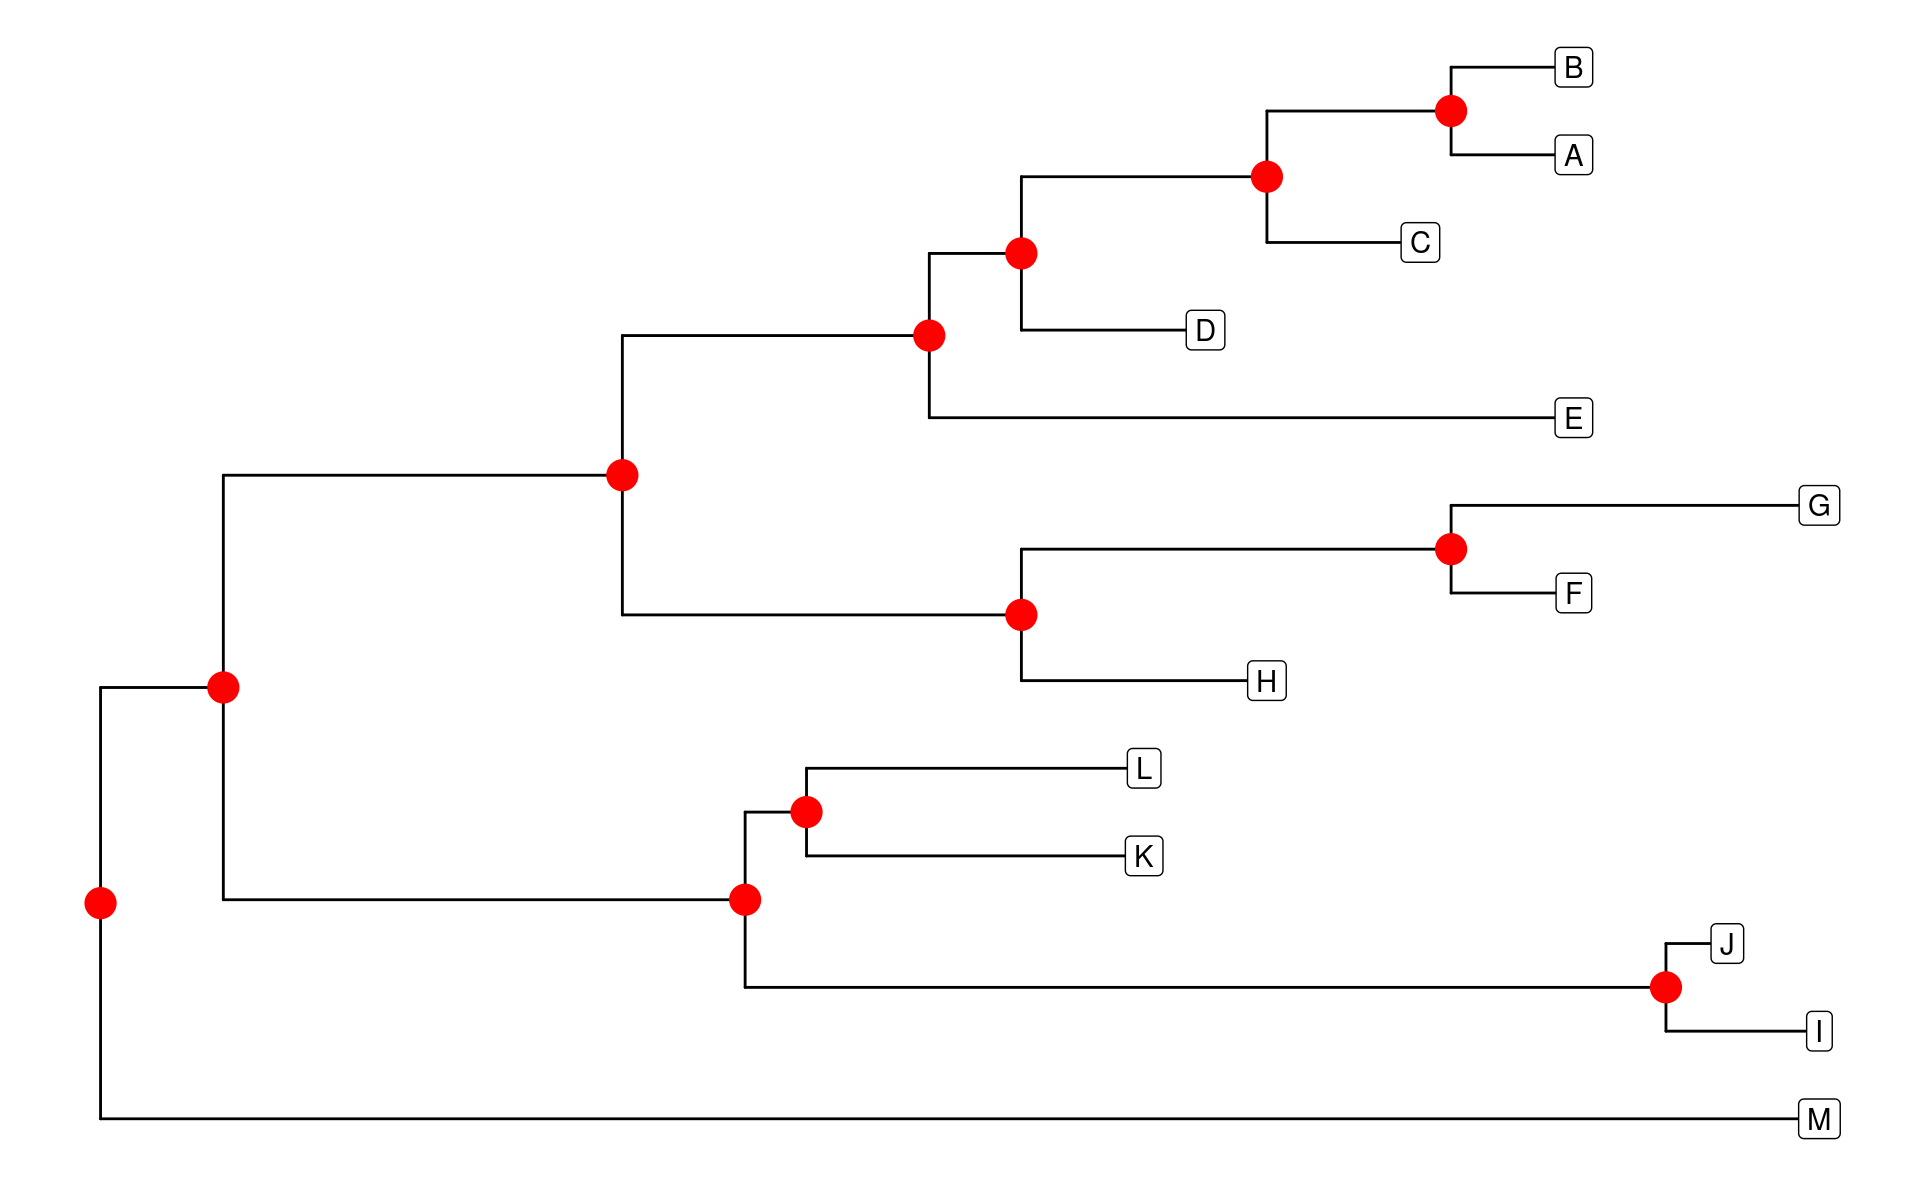
这些函数不仅可以用于tree的绘制,其他类型的散点图也可以使用。除subset映射外,ggtree还提供了两个函数,可以直接应用到geom_*()函数中:
-
td_filter():筛选绘图数据 -
td_unnest():展开绘图数据
p +
  geom_label(aes(label = label), data = td_filter(isTip)) +
  geom_nodepoint(data = td_filter(node == 14), size = 5, color = "red")