suppressMessages(library(tidyverse))
suppressMessages(library(treeio))
suppressMessages(library(ggtree))
suppressMessages(library(ggtreeExtra))
suppressMessages(library(aplot))
suppressMessages(library(ggnewscale))

set.seed(123)

nwk <- system.file("extdata", "sample.nwk", package = "treeio")
tree <- treeio::read.tree(nwk)
p <- ggtree(tree)

df1 <- data.frame(
  first = sample(letters[1:5], 13, replace = TRUE),
  second = sample(letters[23:26], 13, replace = TRUE)
)
rownames(df1) <- tree$tip.label

df2 <- as.data.frame(matrix(rnorm(39), ncol = 3))
rownames(df2) <- tree$tip.label
colnames(df2) <- LETTERS[1:3]ggtree–绘图3
ggtree
本节介绍“域”元素,让我们先加载一个基本的树。
域元素
域元素大致可以分为三类:
- 树比例尺图例
- 多颗树分面
- 树与其他图形的组合
legend
geom_treescale()用来绘制树比例尺图例:
p + geom_treescale(x = 0, y = 12, width = 5, color = "red")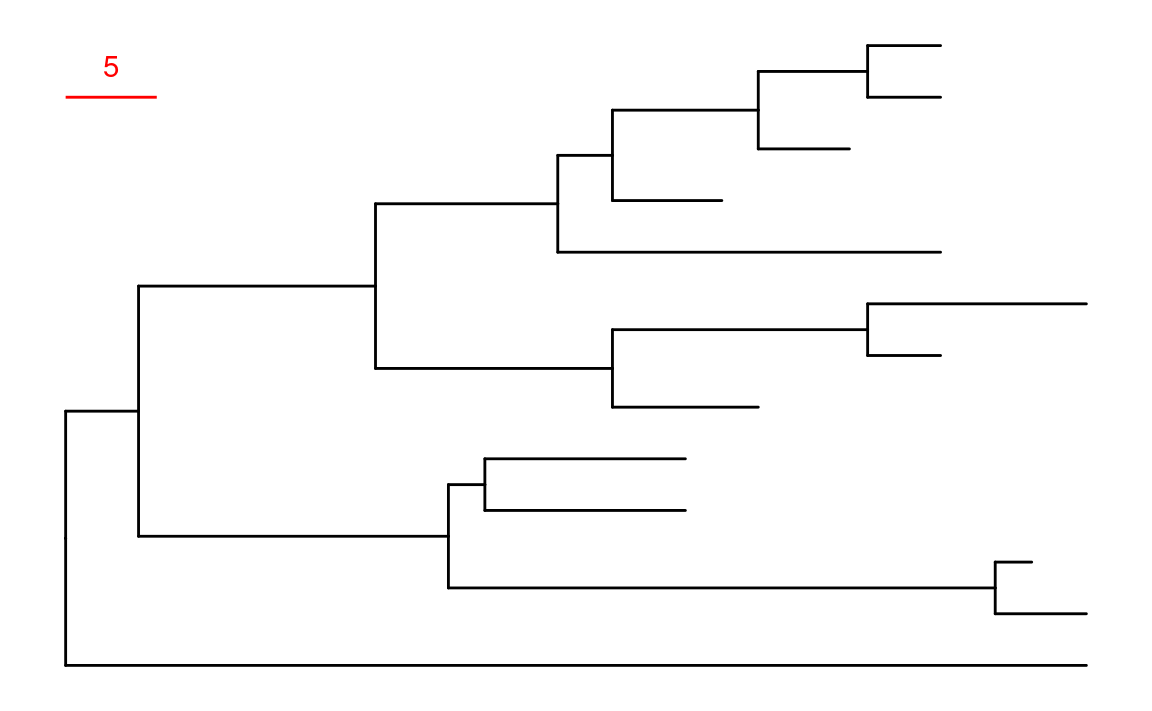
facet
当ggtree()的绘制对象是multiPhylo或treedataList时,可以使用facet_wrap()或facet_grid()进行多颗树分面。可以使用ggnewscale包中的new_scale_*()来添加新的美学映射:
d <- data.frame(label = tree$tip.label, var1 = abs(rnorm(13)), var2 = abs(rnorm(13)))
tree2 <- full_join(tree, d, by = "label") # treedata类型
trees <- c("TREE1" = tree2, "TREE2" = tree2)
class(trees) <- "treedataList"
# ggtree(trees) + facet_wrap(~.id, scale = "free")
p_facet <- ggtree(trees) + facet_grid(~.id, scale = "free") +
  geom_point2(aes(subset = .id == "TREE1" & isTip, colour = var1)) + # 原文此处使用`geom_tippoint()`有bug
  scale_colour_gradient(low = "blue", high = "red") +
  ggnewscale::new_scale_colour() +
  geom_tippoint(aes(colour = var2), data = td_filter(.id == "TREE2")) +
  scale_colour_viridis_c()
p_facet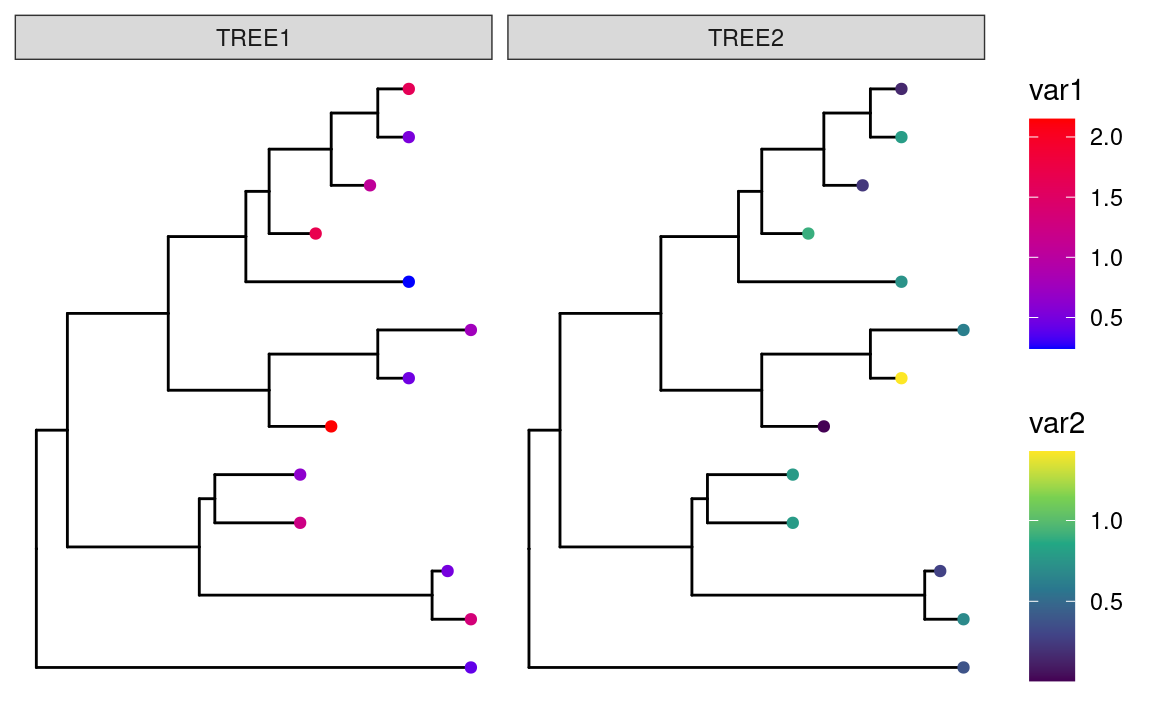
combined
很多时候我们要将不同类型的图与树进行组合,这种组合不是简单的拼接,需要将每个tip进行对齐,实现此类目标大致可以通过三种方式:
- 使用
gheatmap()或msaplot()等特定的复合函数进行定制绘图。 - 使用
geom_facet()或geom_fruit()直接在树图的基础上进行再绘制。 - 使用
aplot::insert_*()函数进行图形拼接。
定制绘图
gheatmap()在ggplot2对象基础上绘制热图,并且可以添加多个热图:
p1 <- p + layout_circular()
p1 <- gheatmap(p1, df1,
  offset = .8, width = .2,
  colnames_angle = 95, colnames_offset_y = .25
) +
  scale_fill_viridis_d(option = "D", name = "discrete\nvalue")

p2 <- p1 + new_scale_fill()
gheatmap(p2, df2,
  offset = 15, width = .3,
  colnames_angle = 90, colnames_offset_y = .25
) +
  scale_fill_viridis_c(option = "A", name = "continuous\nvalue")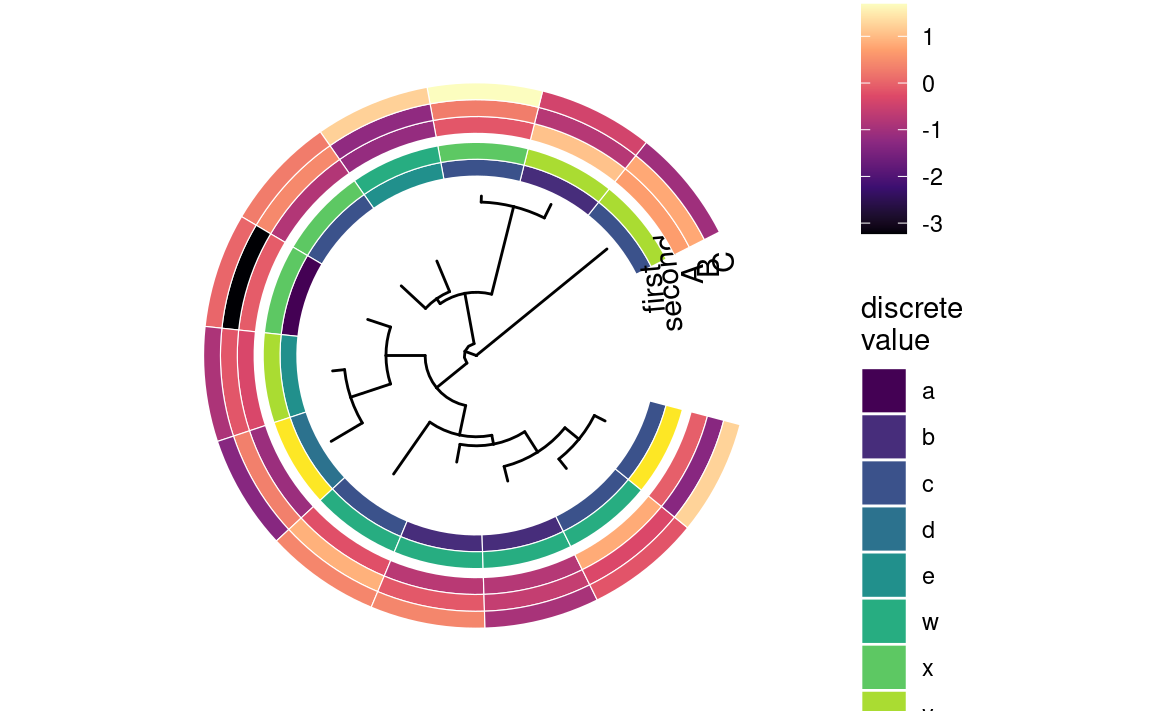
msaplot()与gheatmap()类似,用来添加序列比对信息。
library(TDbook)

# load `tree_seq_nwk` and `AA_sequence` from 'TDbook'
p_seq <- ggtree(tree_seq_nwk) + geom_tiplab(size = 3)
msaplot(p_seq, AA_sequence, offset = 3, width = 2)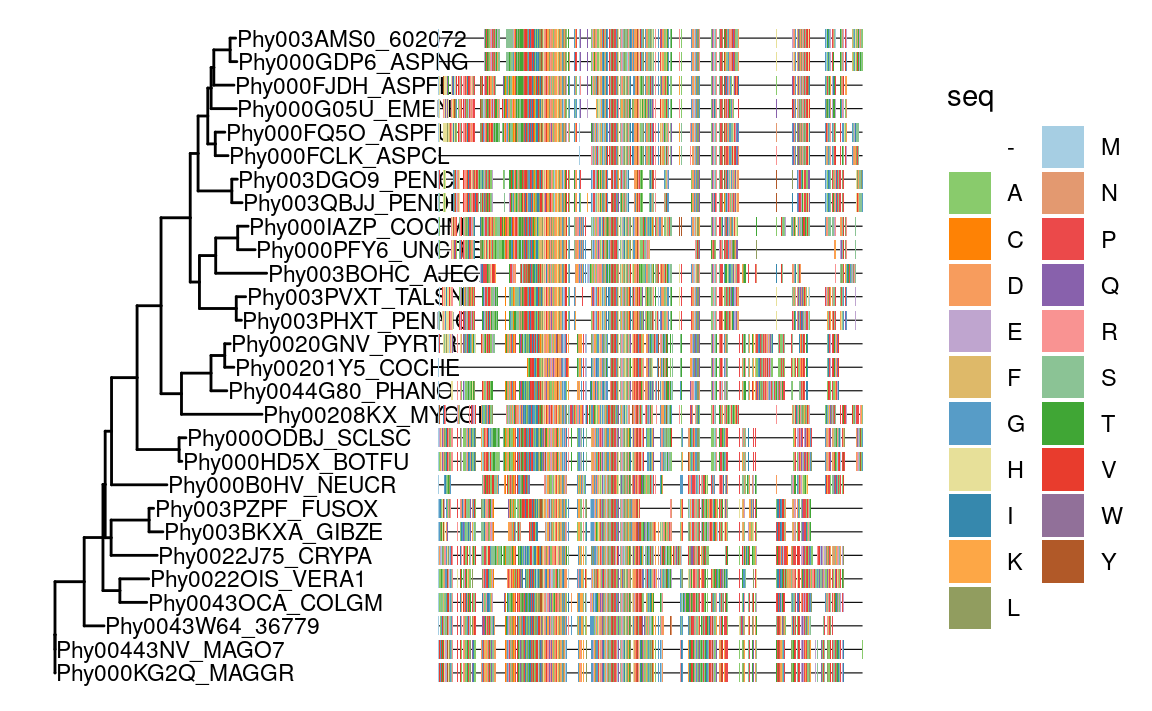
追加图形
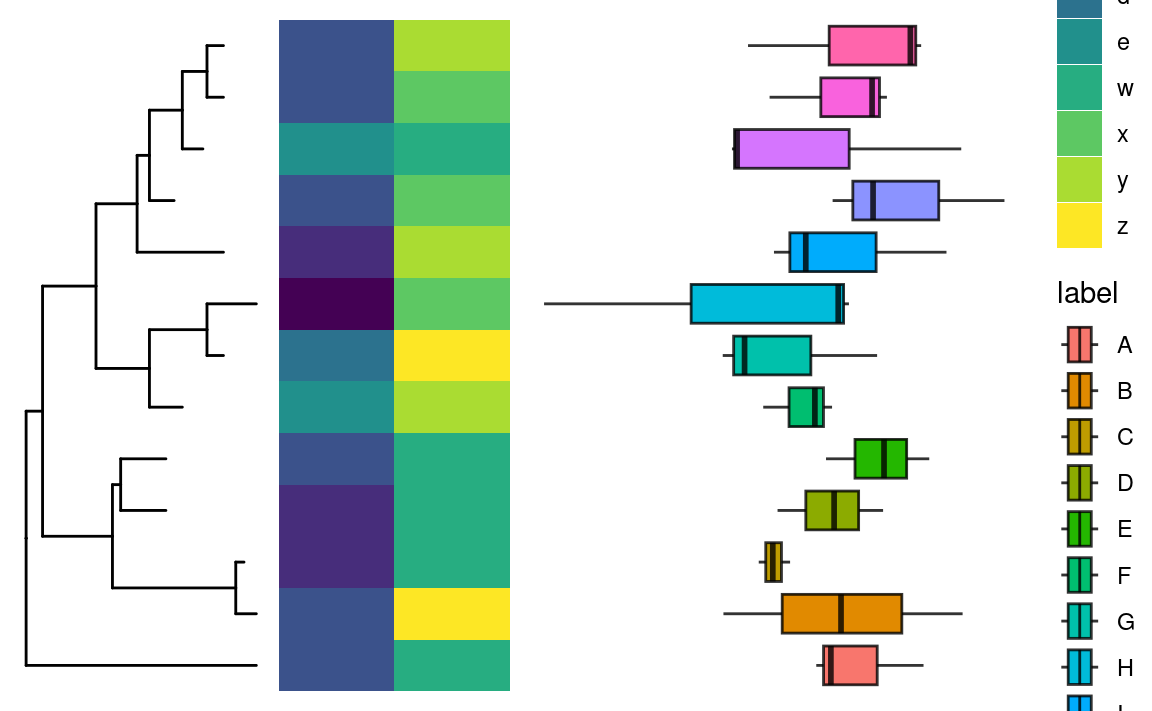
ggtree提供了geom_facet()用来追加图形,但有极大的缺陷。首先它不支持layout为极坐标系的树;其次它追加的图形映射不支持离散的坐标轴,fortify(tree)可以清楚的看到x和y都是连续变量。所以新增了ggtreeExtra::geom_fruit()来解决上述问题。
info1 <- tibble::rownames_to_column(df1, "label") |>
  tidyr::pivot_longer(-label, names_to = "type")
info2 <- tibble::rownames_to_column(df2, "label") |>
  tidyr::pivot_longer(-label, names_to = "type", values_to = "value")
p1 <- p +
  geom_fruit(
    offset = 0.1,
    pwidth = 0.2,
    data = info1,
    geom = geom_tile,
    mapping = aes(x = type, y = label, fill = value),
    axis.params = list(
      axis = "x",
      title = "discrete",
      title.size = 5,
      text.size = 4
    )
  ) +
  scale_fill_viridis_d() +
  new_scale_fill() +
  geom_fruit(
    offset = 1.2,
    pwidth = 1,
    data = info2,
    geom = geom_boxplot,
    mapping = aes(x = value, y = label, fill = label),
    axis.params = list(
      axis = "x",
      title = "continuous",
      title.size = 5,
      text.size = 4
    )
  ) +
  scale_fill_discrete()
p1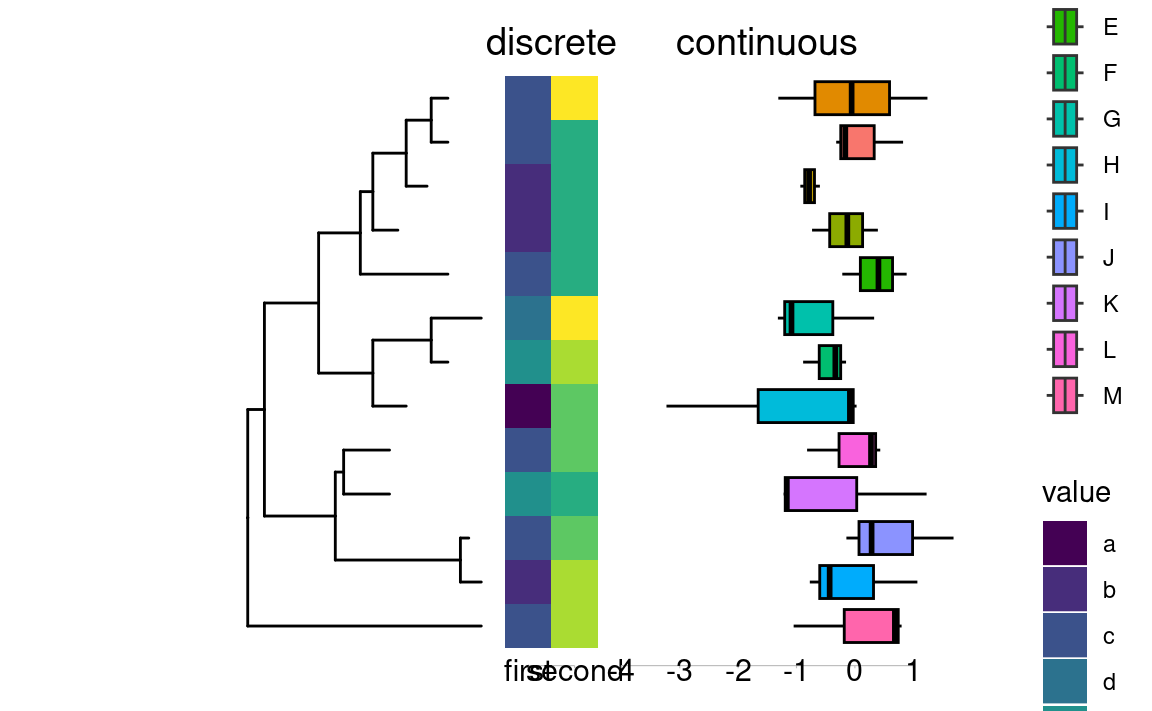
p1 + layout_circular()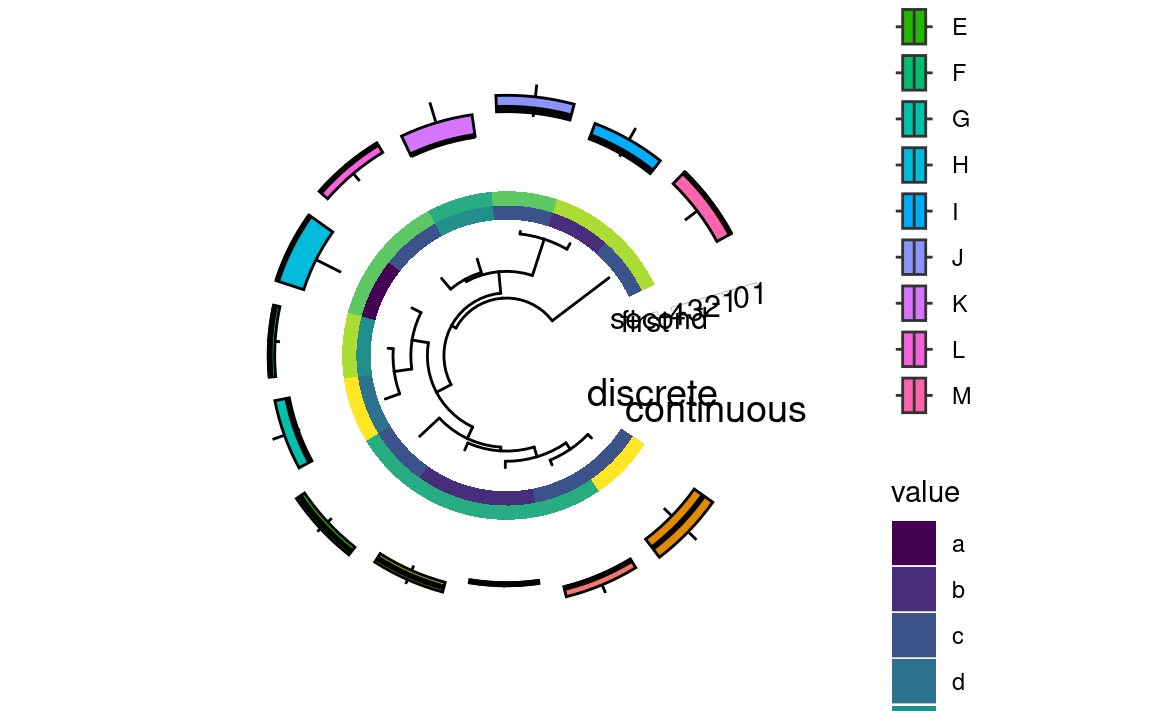
ggtree为使用geom_facet()的对象提供了下面的函数:
-
facet_widths():设置分面宽度 -
facet_labeller():设置分面标签 -
xlim_expand():设置x轴范围
拼接图形
目前图形拼接只适配笛卡尔坐标系。
hp <- ggplot(info1) +
  geom_tile(aes(x = type, y = label, fill = value)) +
  scale_fill_viridis_d() +
  theme_void()
bp <- ggplot(info2) +
  geom_boxplot(aes(x = value, y = label, fill = label)) +
  theme_void()
insert_left(bp, hp, width = 0.5) |>
  insert_left(p, width = .5)